3 min read
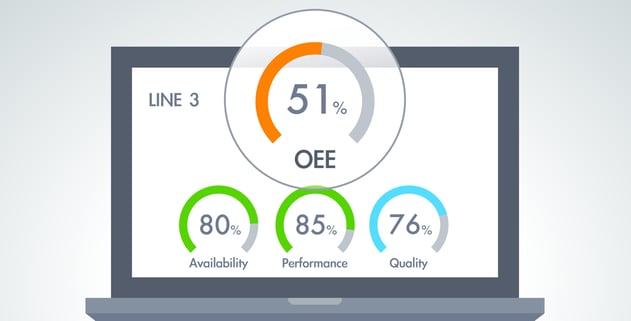
Overall Equipment Effectiveness or OEE, is a best practice method of measuring the manufacturing productivity of your equipment, line or operation. It can be used for discrete, continuous, batch or hybrid operations. It works by measuring the Availability (A), Performance(P) and Quality(Q) of the equipment and production in scope and combining them for an overall score (OEE=AxPxQ).
A, P, and Q
Availability measures time lost to line production stoppages or batch step overruns versus the planned run time – so unexpected lost production time. A process that was expected to run for an hour but only ran for 45 minutes has an Availability of 75% during that hour. A batch step that was supposed to take 45 minutes but took an hour has an Availability equal to 75% during that hour.
Performance measures time lost to small stops or rate reductions. A process that was supposed to produce 1000 liters or 1000 bottles during the last hour but only produced 750 liters or 750 bottles has a Performance equal to 75% during that hour.
Quality measures time lost to production that is scrap or rework. If a process produces 4 250-kg bags in one hour but sampling determines that one bag is not first quality saleable product, the process has a Quality equal to 75% during that hour.
Depending on the nature of the process, lost production may fall into any one of these three “buckets.” For example, an extrusion process that diverts “bad” material may consider that a Productivity loss but a bottling operation that diverts mis-labeled bottles may consider that a Quality loss. It does not matter as long as it is captured and not double-counted.
Availability, Performance and Quality are all measured as percentages and therefore so is OEE. A process that has Availability of 75%, Performance of 75% and Quality of 75% has an OEE of just 42%! This is why it is important to measure OEE – to compare one operation with another but also to identify the sources of these losses and minimize them as soon as possible (improving the OEE).
The Case Against Paper
It is tempting for engineers just starting to understand this to turn to paper or Excel spreadsheets and ask the operators and engineers to begin to record the start and stop times of the process, the duration of the batch, the rate at which the process ran, the results of quality sampling, the count of rejects, etc. That may be OK initially to get an understanding of how OEE works and get a rough estimate of the current OEE metrics but it’s like using an umbrella in a hurricane – it won’t work very well and will quickly be more trouble than it’s worth. The data will be inaccurate, difficult to collect and becomes a distraction to the operators and engineers who will wonder why this is needed if the results are questionable anyway. Instead, tap into the power of open standards and digitalization to get your control systems and manufacturing systems to provide these metrics in real time. Automate your OEE and you create a valuable, real-time operating tool that can have benefits to everyone from the plant manager down to the operators.
How Is This Done?
Modern control systems and instrumentation start and stop the process, set and control the rate, manage and measure the movement of material through the process. With technologies like OPC UA and ODBC, this information can be accessed by various system that can be used to generate OEE metrics. In the simplest implementations, these systems just generate the metrics and perhaps only for specific time periods. That alone is useful for comparing metrics over time that are accurate, transparent and don’t require manual input. However, slightly more sophisticated systems can add a lot more value.
Many control systems also generate alarms and fault codes. With the proper configuration, these can also be integrated into the OEE system to automatically collect the reason for the loss in productivity (“label jam”, “starved for raw material”, stop button pressed”, “motor fault”, etc.) More capable OEE systems can present the causes of the downtime in tabular or chart form for use by engineers, maintenance or operators to drill down and solve the real causes of lost productivity.
Where the control systems cannot produce this data, the operator must be asked to provide this information – because only they can. Only what is needed from them – not the start or stop, just what happened. This is where they become a more valuable contributor to the efficiency of the plant. In return, they get to see immediate feedback of their activities on the OEE, in real time and over time.
Capable systems can store and present this data for any time period selected and can be filtered by any parameter that can be captured by the system along with the metrics - think of examining OEE by product, process order, shift, operating team, raw material lot used and more.
Collecting data manually as a means of dabbling in OEE can be an interesting intellectual exercise. However, collecting and presenting accurate and transparent OEE metrics together with the data that reveals what is going on within the process has the ability to drive a step change in the culture and capability of your operating and maintenance teams. Why walk when you can run?
Related Posts
Reverse Engineering Your Control System: Our Tips and Tricks
Your control system has been running for 25 years and it is now time to modernize. Before you can...
From Empty Room to Control Room: Designing a Usable Space
When you are (eventually) back in your office, you want an environment that is going to be...
Reducing Downtime through Control System Preventative Maintenance
Your control system is the lifeblood of your operations. Whether your installed systems are modern,...